Pyinstrument 5 - Flamegraphs for Python
I’m proud to announce the release of Pyinstrument 5.0.0!
This release brings something that’s been years in the making.
Context
First, some context: Pyinstrument is a statistical profiler for Python. That means you can activate it when you’re running your code, and pyinstrument will record what happens, and at the end, give you a report that tells you where the time was spent.
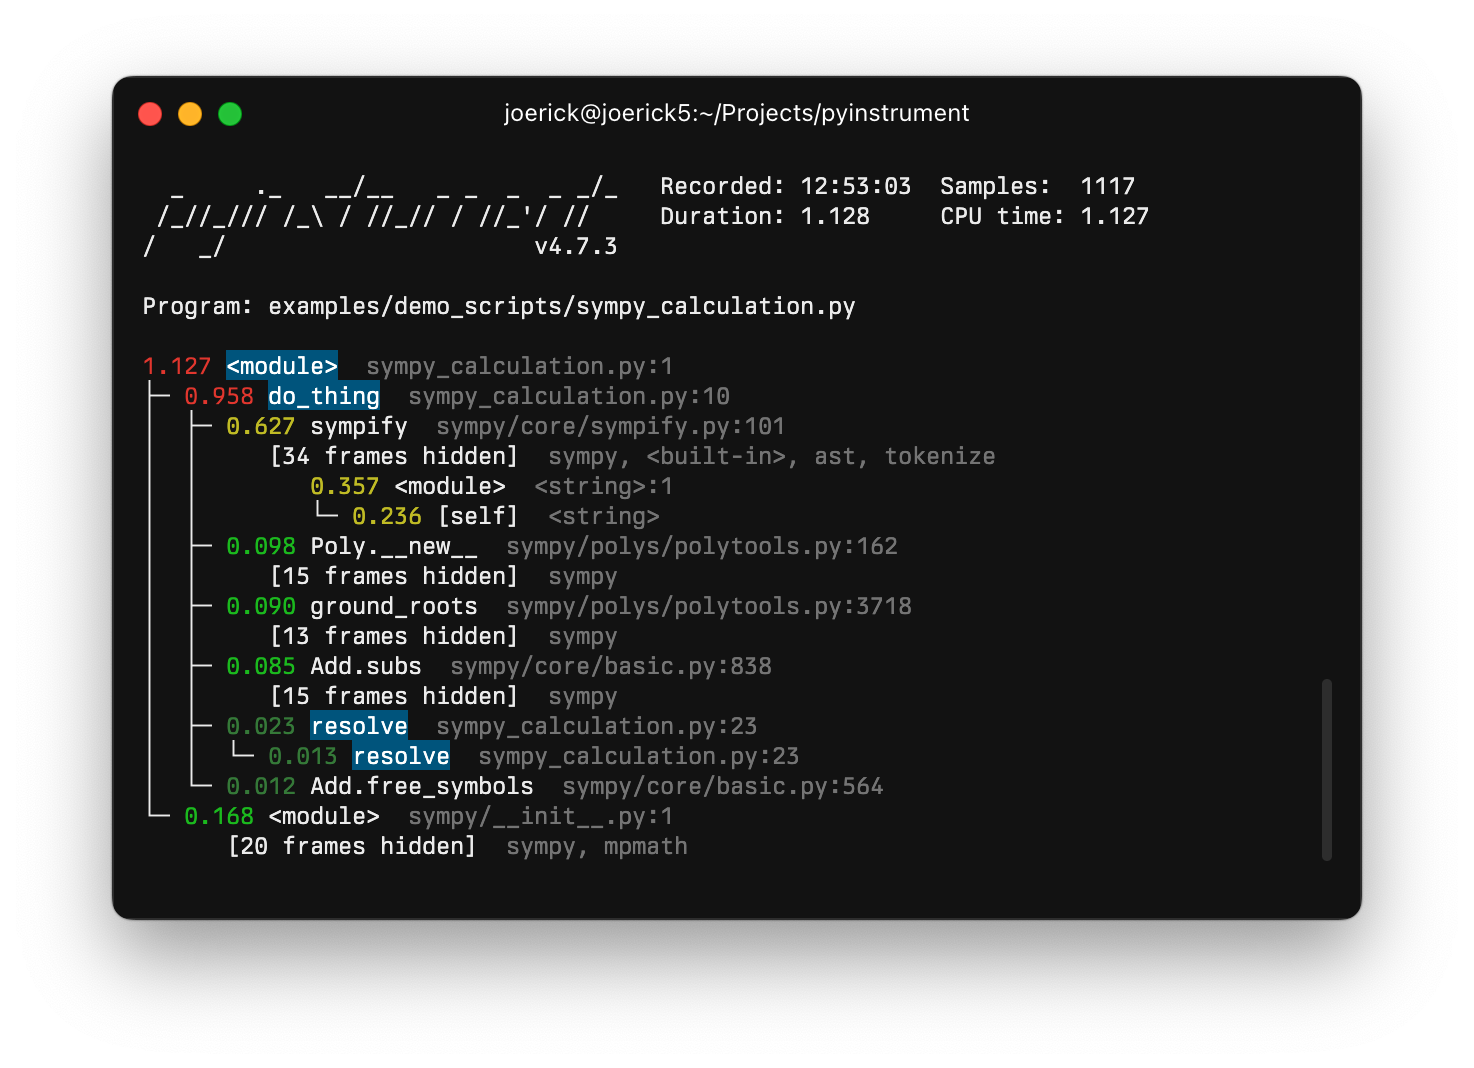 The default output - the call stack view as rendered in terminal
The normal mode for pyinstrument is a ‘call stack’ view, which prints a sorted tree of functions and methods where the time was spent. But for a while now, Pyinstrument has been able to render in ‘timeline’ mode - meaning that the output is in the order that the program executed.
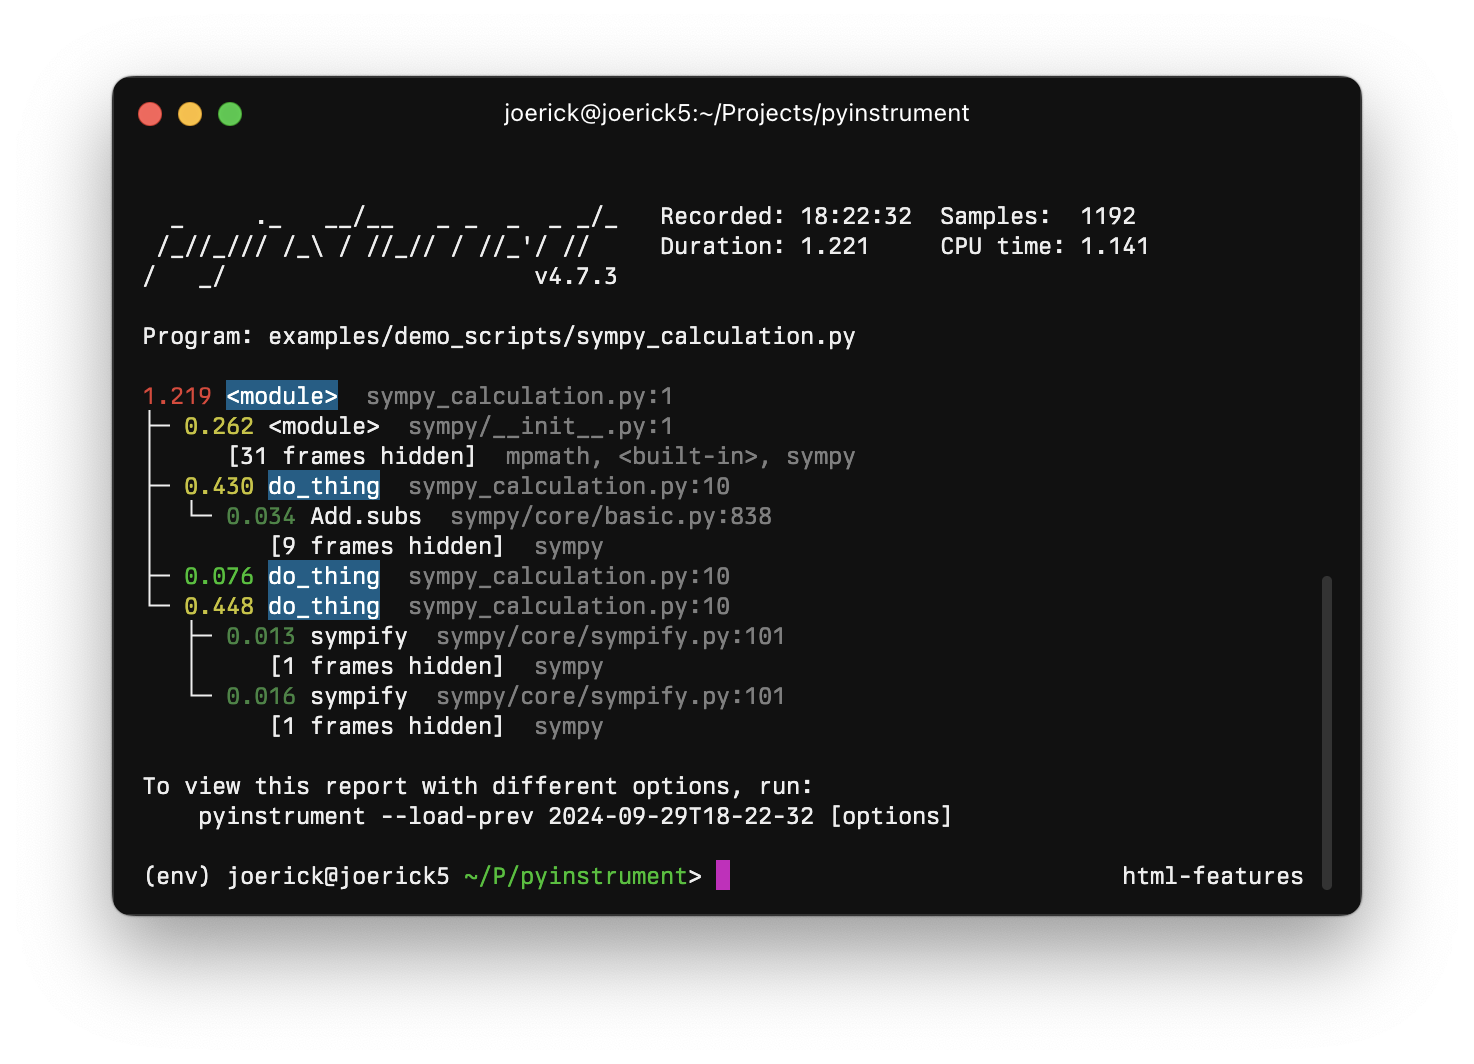 The timeline mode from pyinstrument 3+ - note the we see the
 do_thing function happens after the module-level imports.
This is cool, but it doesn’t map to my brain all that well. I find it hard to read. I was always a fan of Chrome Devtools Performance mode, which looks like this:
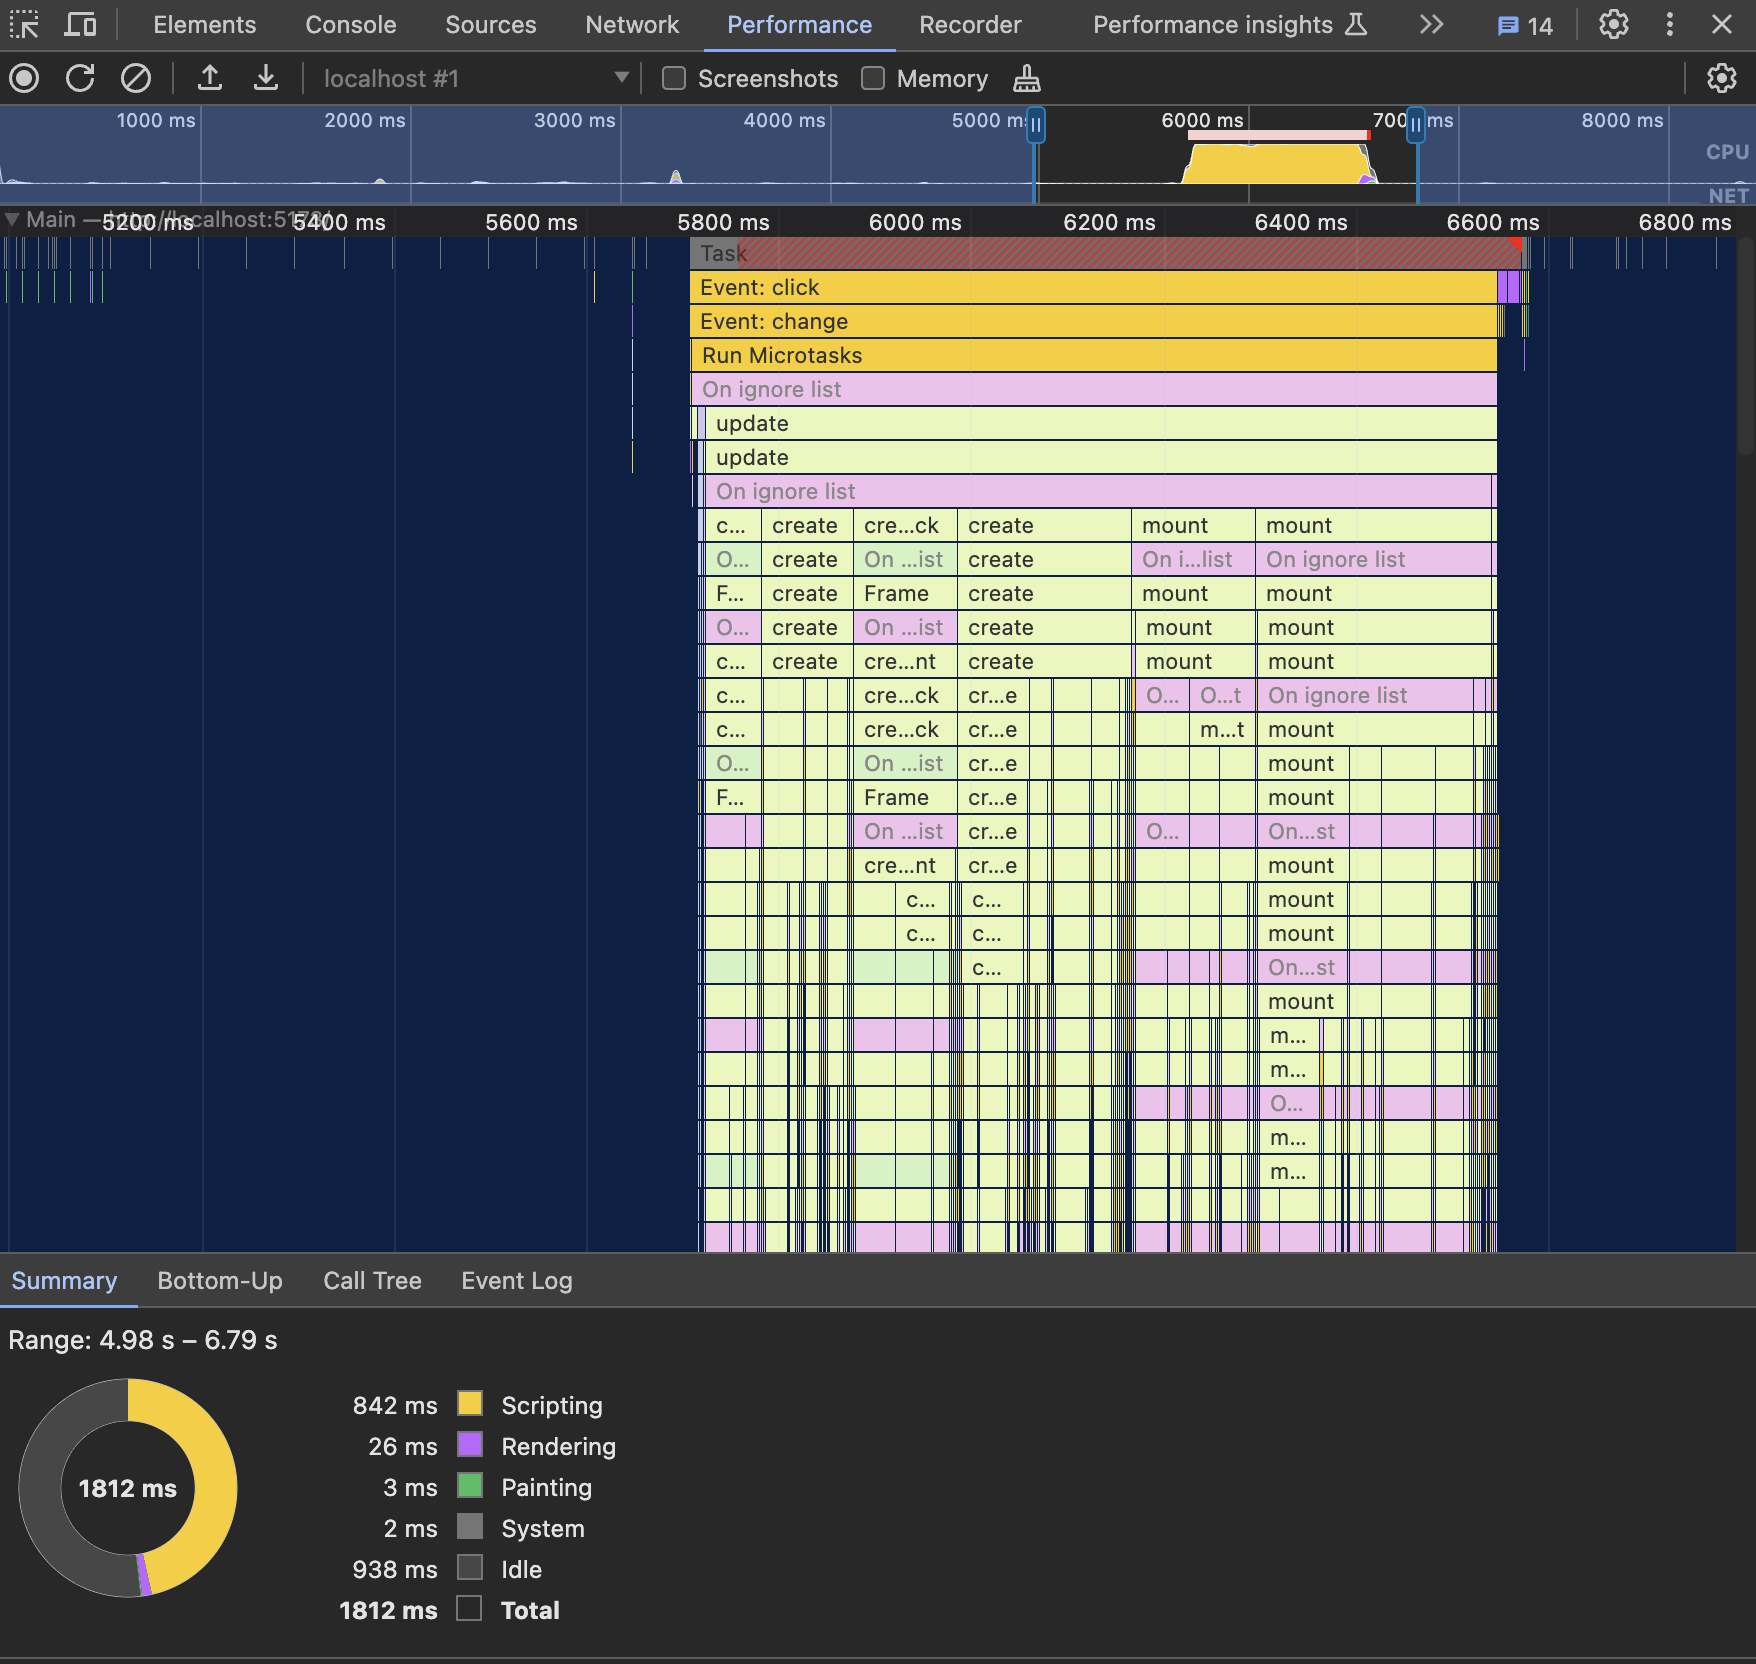 Chrome devtools performance mode
It’s really nice and interactive. Another example, which actually does work with pyinstrument already, is Speedscope.
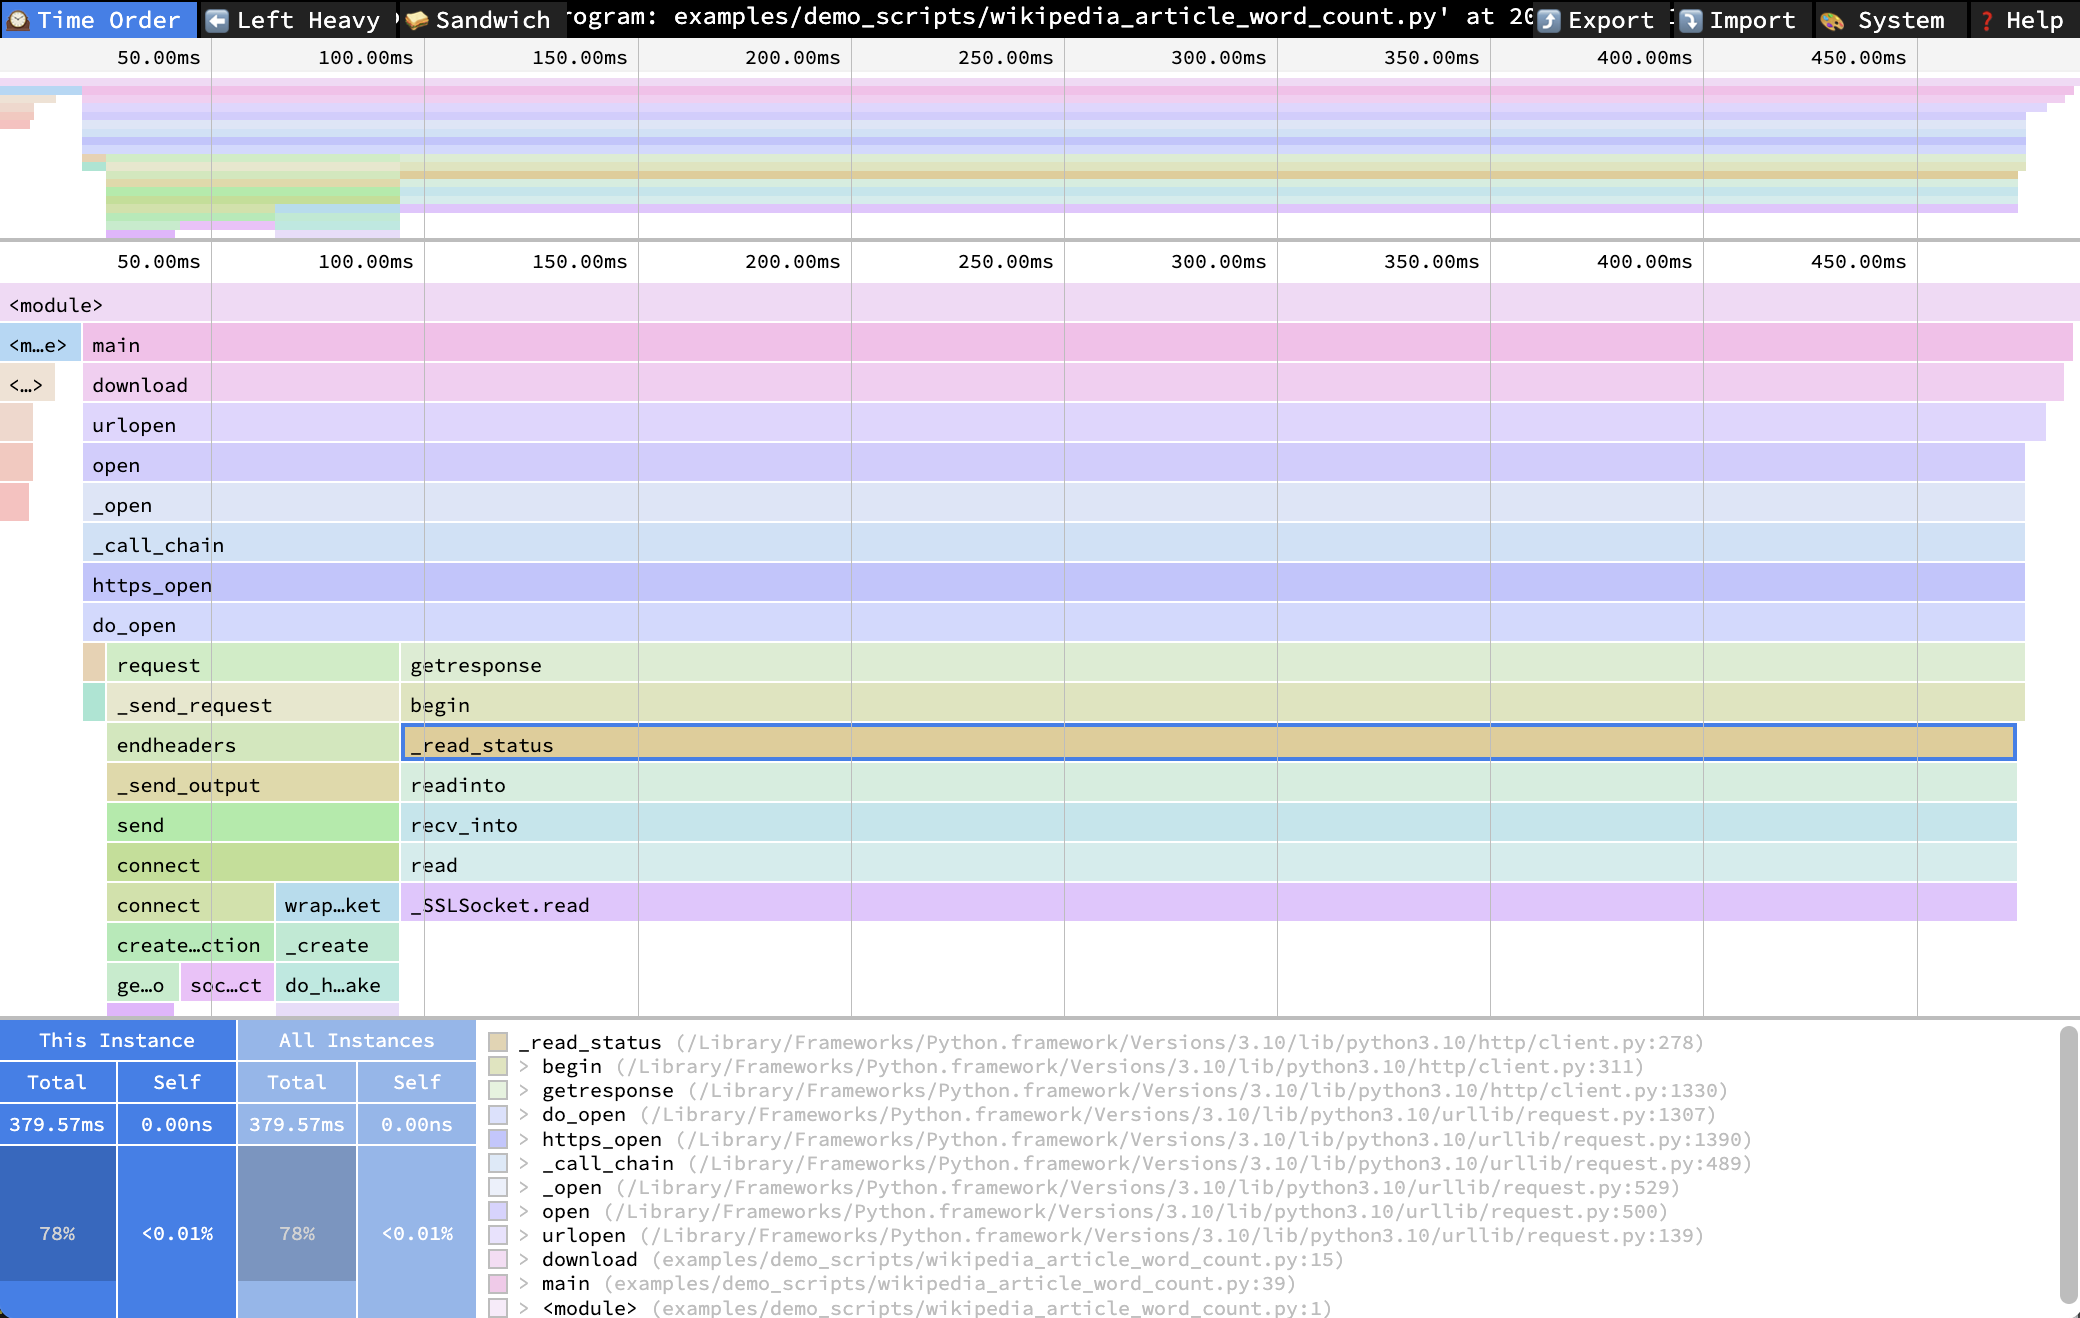 A pyinstrument profile in speedscope
This is pretty nice, but it’s hard to use inside pyinstrument, because you have to write it to a file, go to the speedscope site, and upload it every time you want to use it.
The new timeline mode
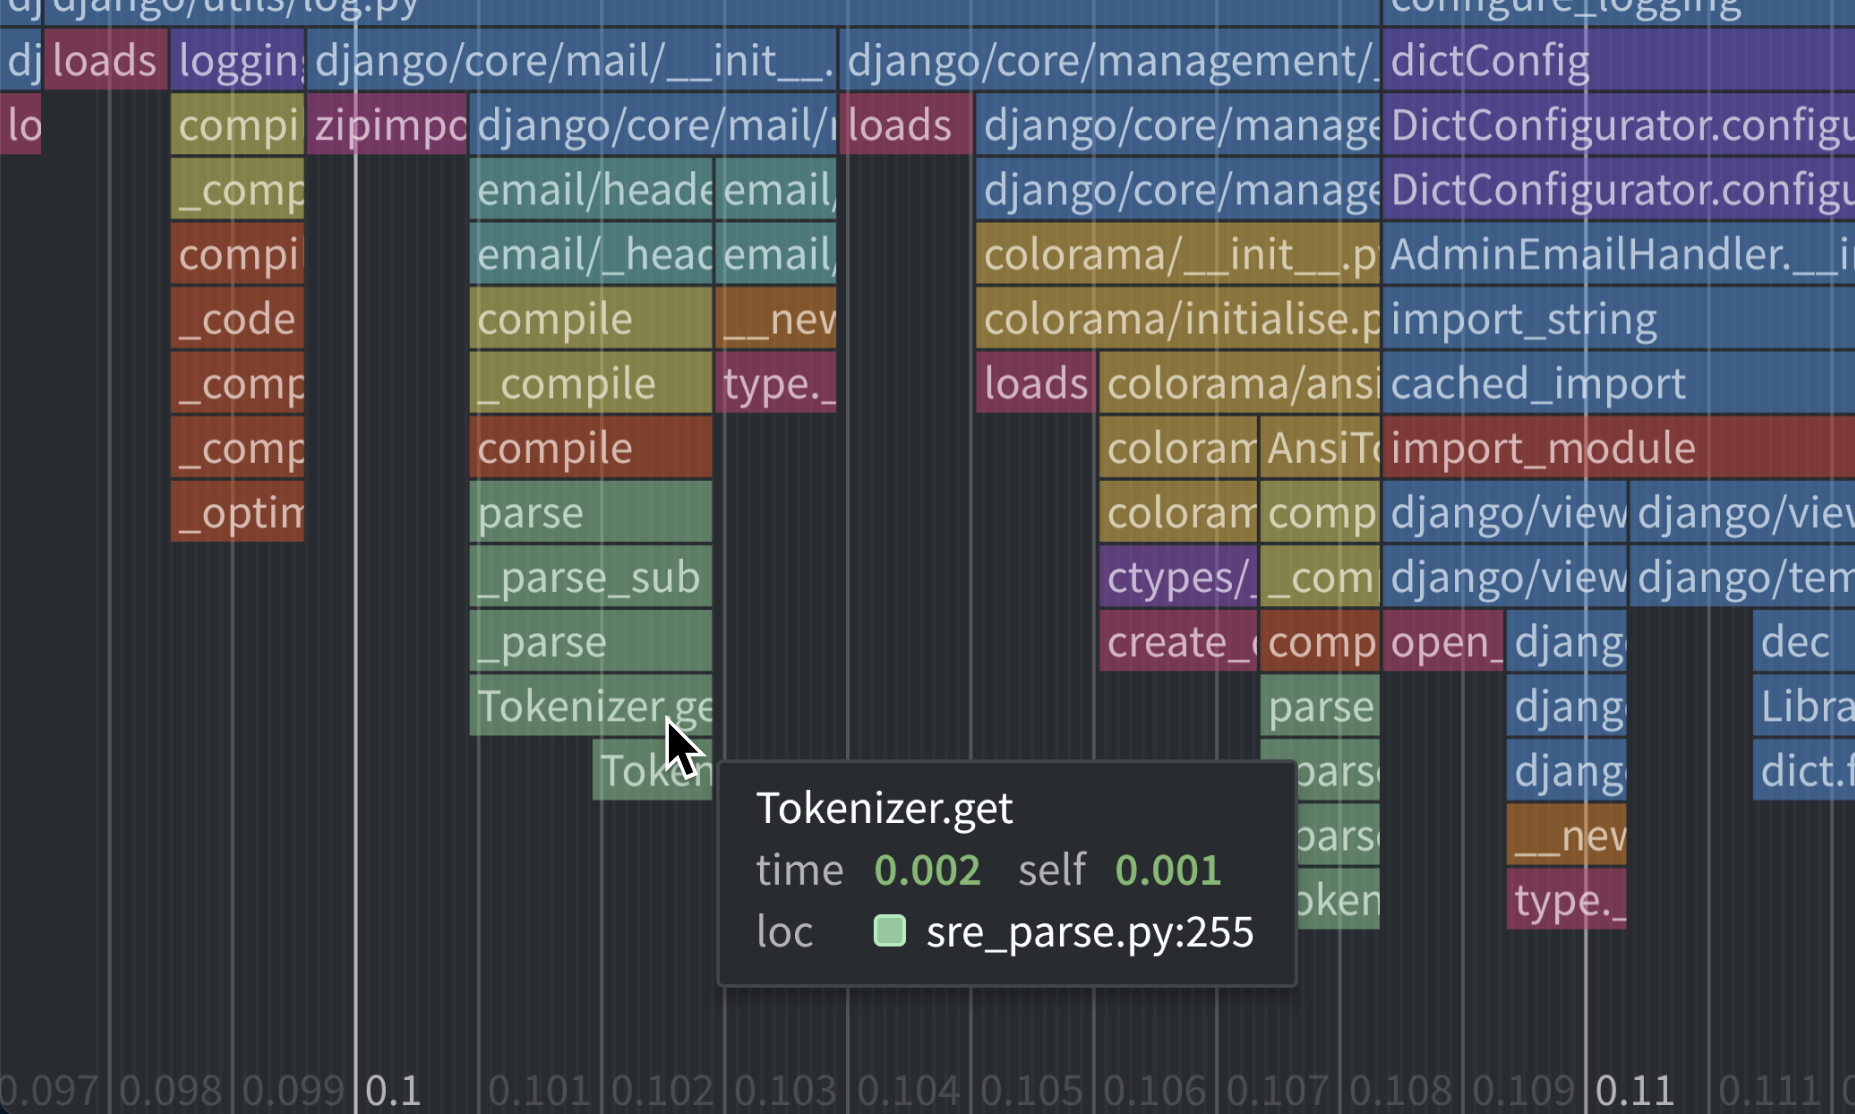
In pyinstrument v5, if you profile your script using pyinstrument -r html myscript.py, you’ll get something like this:
The new pyinstrument timeline mode
It’s very useful from a performance perspective, but also it’s a really nice way to gain a bit more insight into a program - see what’s actually going on under the hood.
This new timeline UI is purpose-built for pyinstrument and Python. The timeline lives alongside the existing call stack visualisation - to do this efficiently, they’re both rendered from the same data.
In making that work, it unlocked another feature that I wanted for a while - a way to change view options from inside the webpage, rather than passing options at the command line.
There are more controls on the Call stack view:
Call stack view options
But also there are a few options on the timeline view:
Timeline view options
Oh, did I mention it’s buttery smooth 60fps even with thousands of frames on screen? :)
How did you do this?
Pyinstrument is mostly a python codebase. A large part of the rendering pipeline existed as functions called ‘processors’ - these functions transform the tree of frame objects to produce different readouts.
To make timelines, I needed to change the set of processors that run. So a large part of this work was reimplementing these functions in Typescript1 - that way, they can be enabled/disabled and customised according to what the user is looking at.
That was the hard bit. Once that was done, it was just the fun part of writing the interface. That was implemented in a HTML 2D Canvas. I do quite a bit of writing UIs in Typescript for my day job at Nord Projects, so I had a few ideas here :)
Aside- colors
A fun aspect of the design was how to color the frames. I knew I wanted the colors to represent the library/module that the frame was from. So, I needed a categorical color scheme - one where each color is as visually distinct as possible. But, I don’t know when designing the scheme how many colors I’ll need! So I needed an algorithm to generate them.
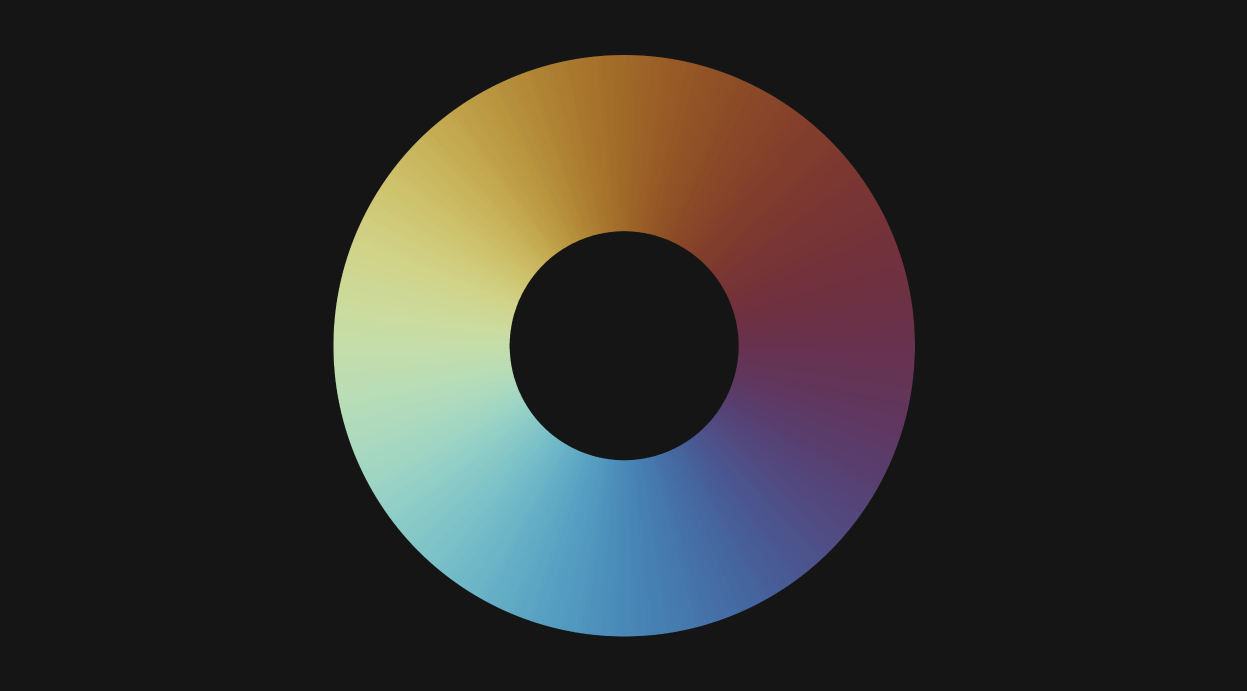 The RomaO cyclic colormap
After looking for solutions online, I came across this cyclic colormap - RomaO by Fabio Crameri. In contrast to most linear colormaps, while it spans lots of hues, it doesn’t have a huge range of brightness. That’s great for this application, because the boxes will be visible on the dark background, and the text will be visible on top of the boxes. It served as a good starting point.
From there, I tweaked the colors, to increase the hue variation and reduce the brightness variation across the range.
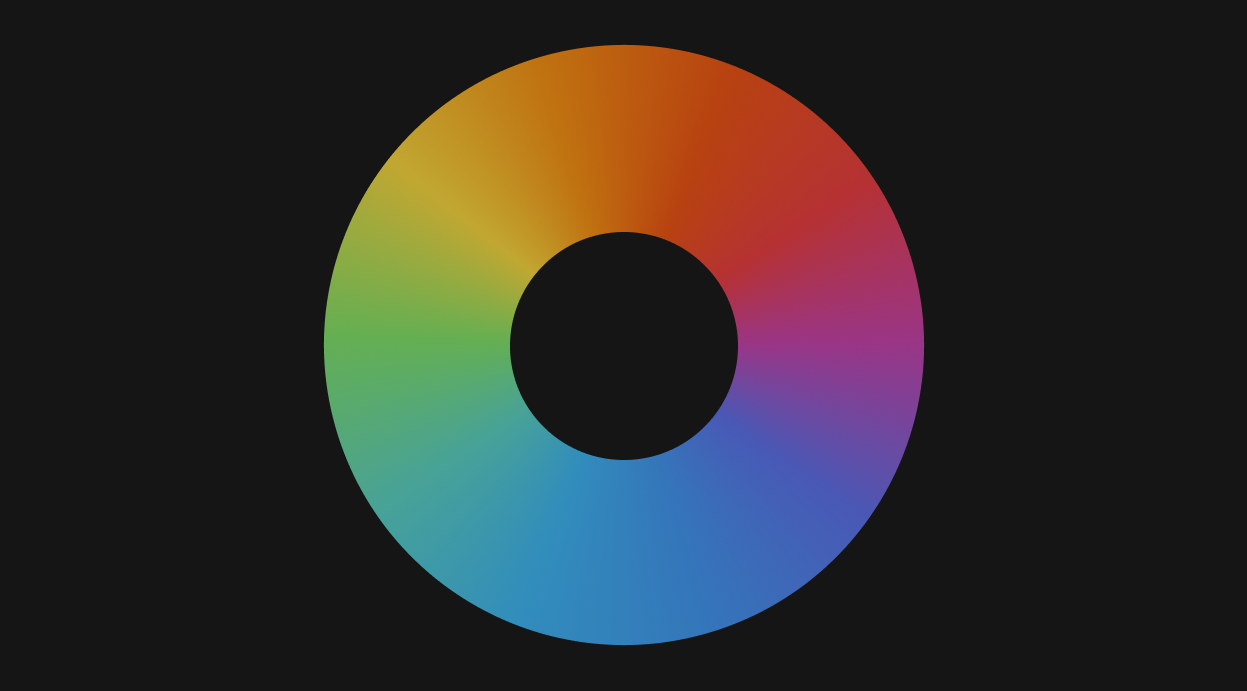 The colormap I ended up with, after some trial and error. It doesn’t look as good aesthetically as the original, but it gives better definition to the categories.
Now, I needed an algorithm to choose the colors. I devised a system that would sort the needed colors by frequency of use, and then choose colors so the most frequently used colors were the furthest apart.
Color choice algorithm - The wheel is gradually bisected, such that the most commonly used colors are the furthest apart from each other. No color ever reused.
Other things to mention
I took the opportunity to make other improvements to the HTML mode:
- I streamlined the design of the page header, it was taking up too much space in the old design.
- The Call stack view supports arrow key navigation.
- The way ‘library’ code is detected has been changed. Previously, if the string ‘/lib/’ occurred in the file path, that was considered library code (and collapsed by default). Now, pyinstrument captures the paths of the Python install and any active virtualenv/conda env at profile time. Files that are stored there are considered library. That should give fewer false positives.
- Calls to
profiler.start()can now pass atarget_descriptionparameter, which is displayed in the profile readout.
Give it a try!
Try out the HTML output with some sample profiles online.
Then grab the latest pyinstrument using pip:
$ pip install -U pyinstrumentAnd then run a script using pyinstrument -r html where you’d previously do python.
Let me know what you think on Mastodon, Reddit or Github.
Footnotes
-
Initially, I spent a while trying to make these functions DRY - so they were only implemented in one language and a) run in a VM or b) translated programmatically. But every DRY method had undesirable tradeoffs. In the end, I just did the simple thing - rewrote each function by hand in Typescript. ↩