Launching Pyinstrument 2.0
Today I’m launching Pyinstrument 2.0. Pyinstrument was my first open-source library to have widespread usage, so it’s very dear to my heart.
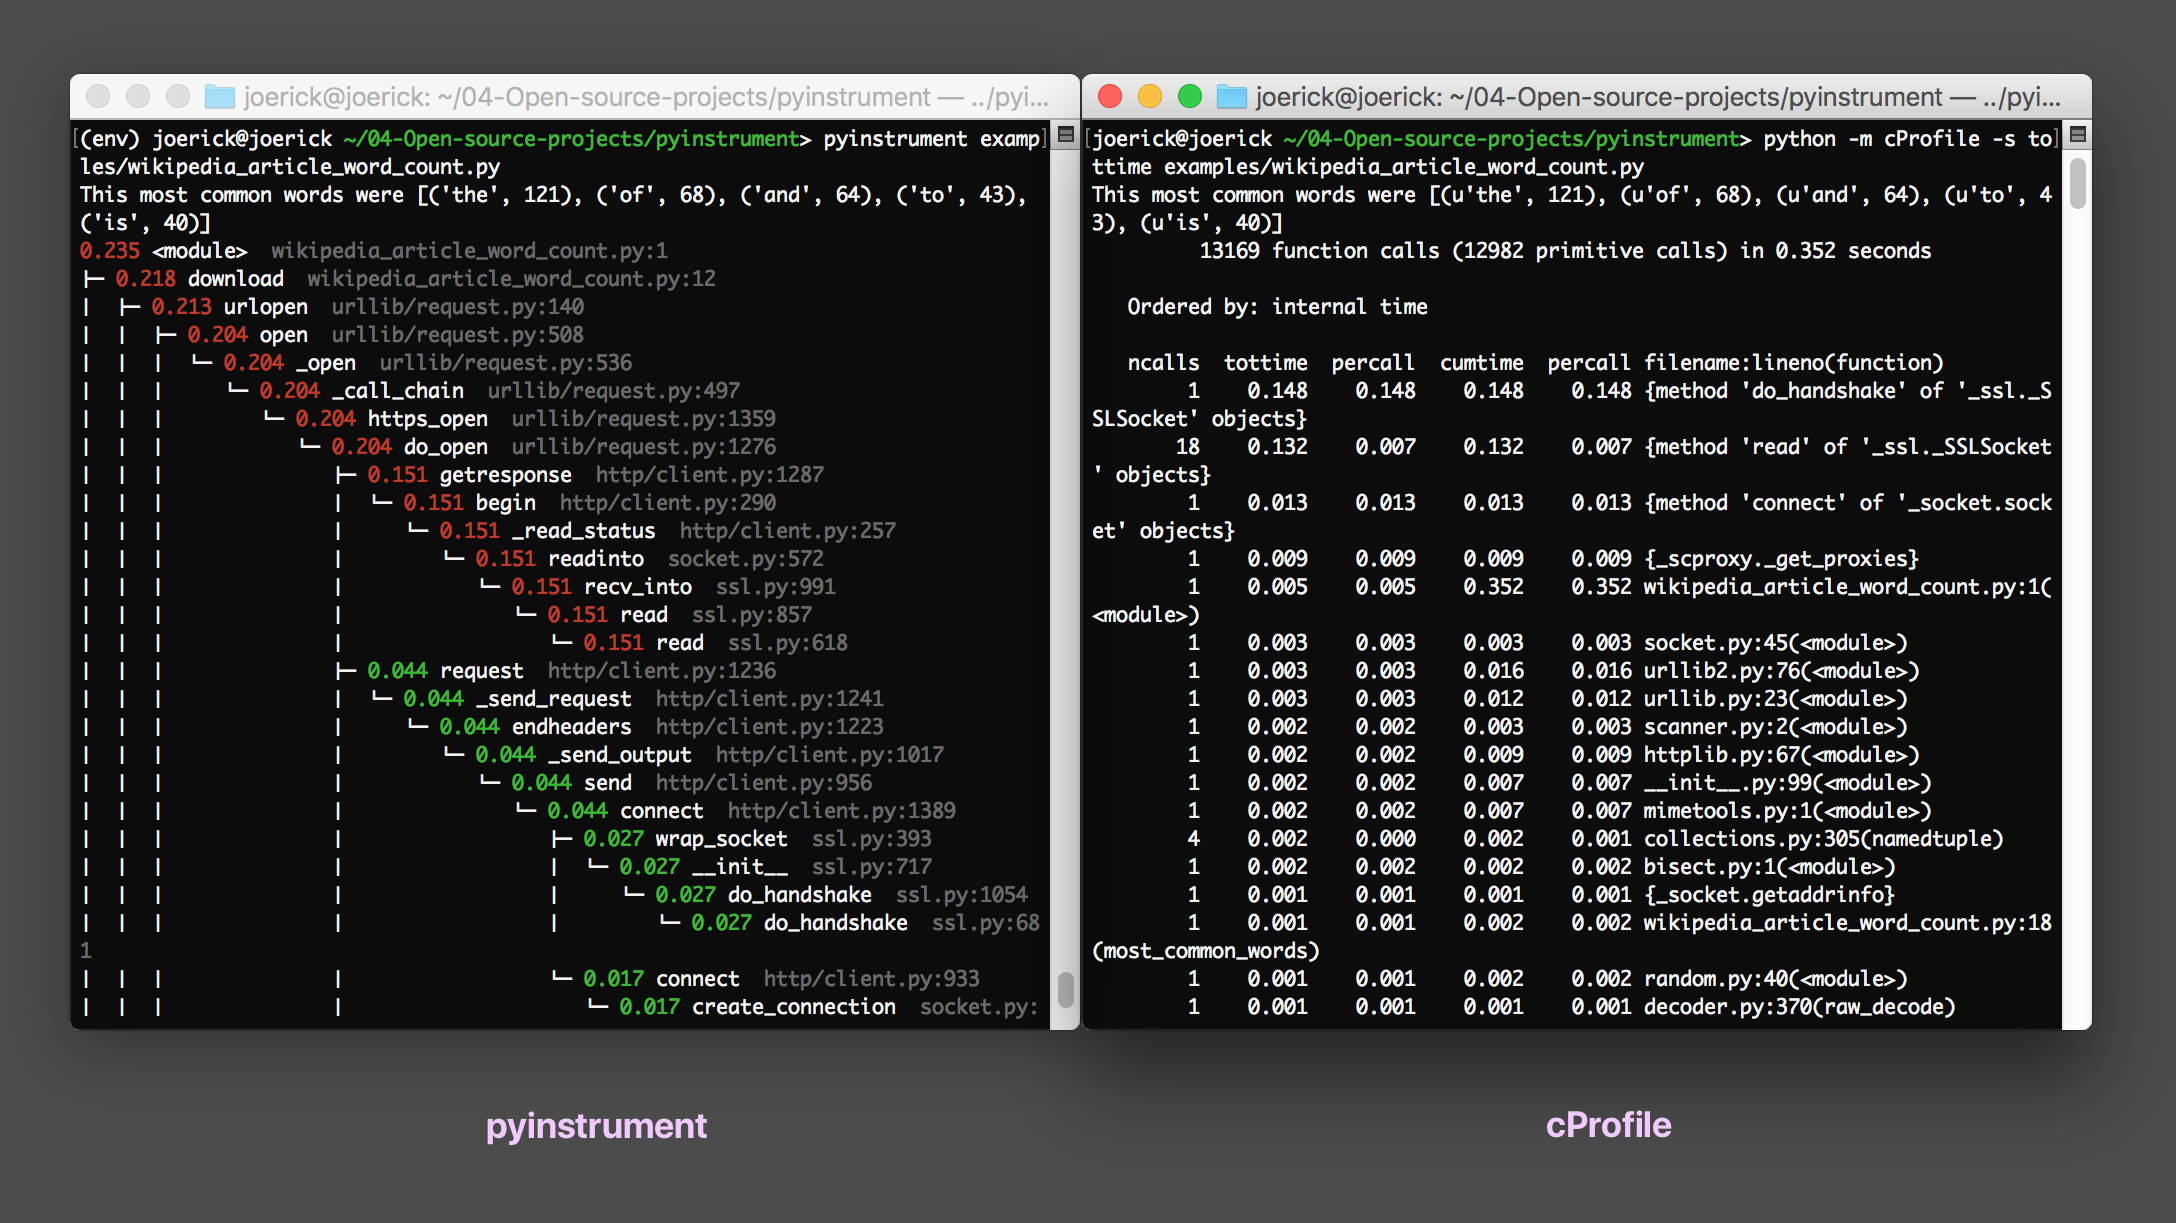
Pyinstrument tells you which sections of code are making your software slow. It does this by observing your program’s execution and then presenting a report that highlights the slow parts. Check it out on Github.
This update brings a few improvements, mostly by changing the underlying technology.
Statistical profiling
I made pyinstrument for two reasons - one, I found it difficult with profile/cProfile to find the code to focus on, and two, I wanted the profiler to have very low overhead so instrumenting the code would not distort performance.
This makes pyinstrument more accurate in programs that have a lot of function calls, because it doesn’t add overhead at each function call. That means that pyinstrument cannot distort timings that have a lot of function calls (e.g. a Django template render), but it means we lose some information. However, the function frames that are lost are the fastest-running ones - samplers are supposed to find the slowest code, so this is fine.
The easiest way to implement this is via an OS-provided feature called ‘signals’. A program can ask the OS to send a signal in the future, and when it does, Python will run a ‘signal handler’ function. This is how Pyinstrument 1.0 does its profiling. However, it comes with some problems.
- You can’t profile code that’s not on the main thread - signal handlers are run by Python on the main thread, even if you started the profiler on a different thread. 1
- It can interfere with IO - if your program is waiting on a system call (such as a
read()from a socket, the signal will force that call to fail so the signal handler can run. This results in some strange behaviours (including sporadic IOErrors and instantly returningsleep()calls) - Conflicts with other libraries/app code. Pyinstrument uses the
SIGALRMsignal, so if your program also needs that, it won’t work.
To work around these problems, Pyinstrument shipped with ’setprofile’ mode. In this mode, Pyinstrument would use the Python-supplied sys.setprofile() call to get callbacks from the interpreter, but would ignore them until 1ms had passed. This was fine, but it brings back some of the original problems - notably, the timings distortions when a lot of function calls are used.
C extensions to the rescue!
Lurking in the Python C API is the function PyEval_SetProfile which is the hook that cProfile uses to get access to the frame objects without the overhead of a Python C function call.
By combining the technique used in pyinstrument 1.0’s ‘setprofile’ mode with this PyEval_SetProfile call in a C extension we have a pretty neat solution!
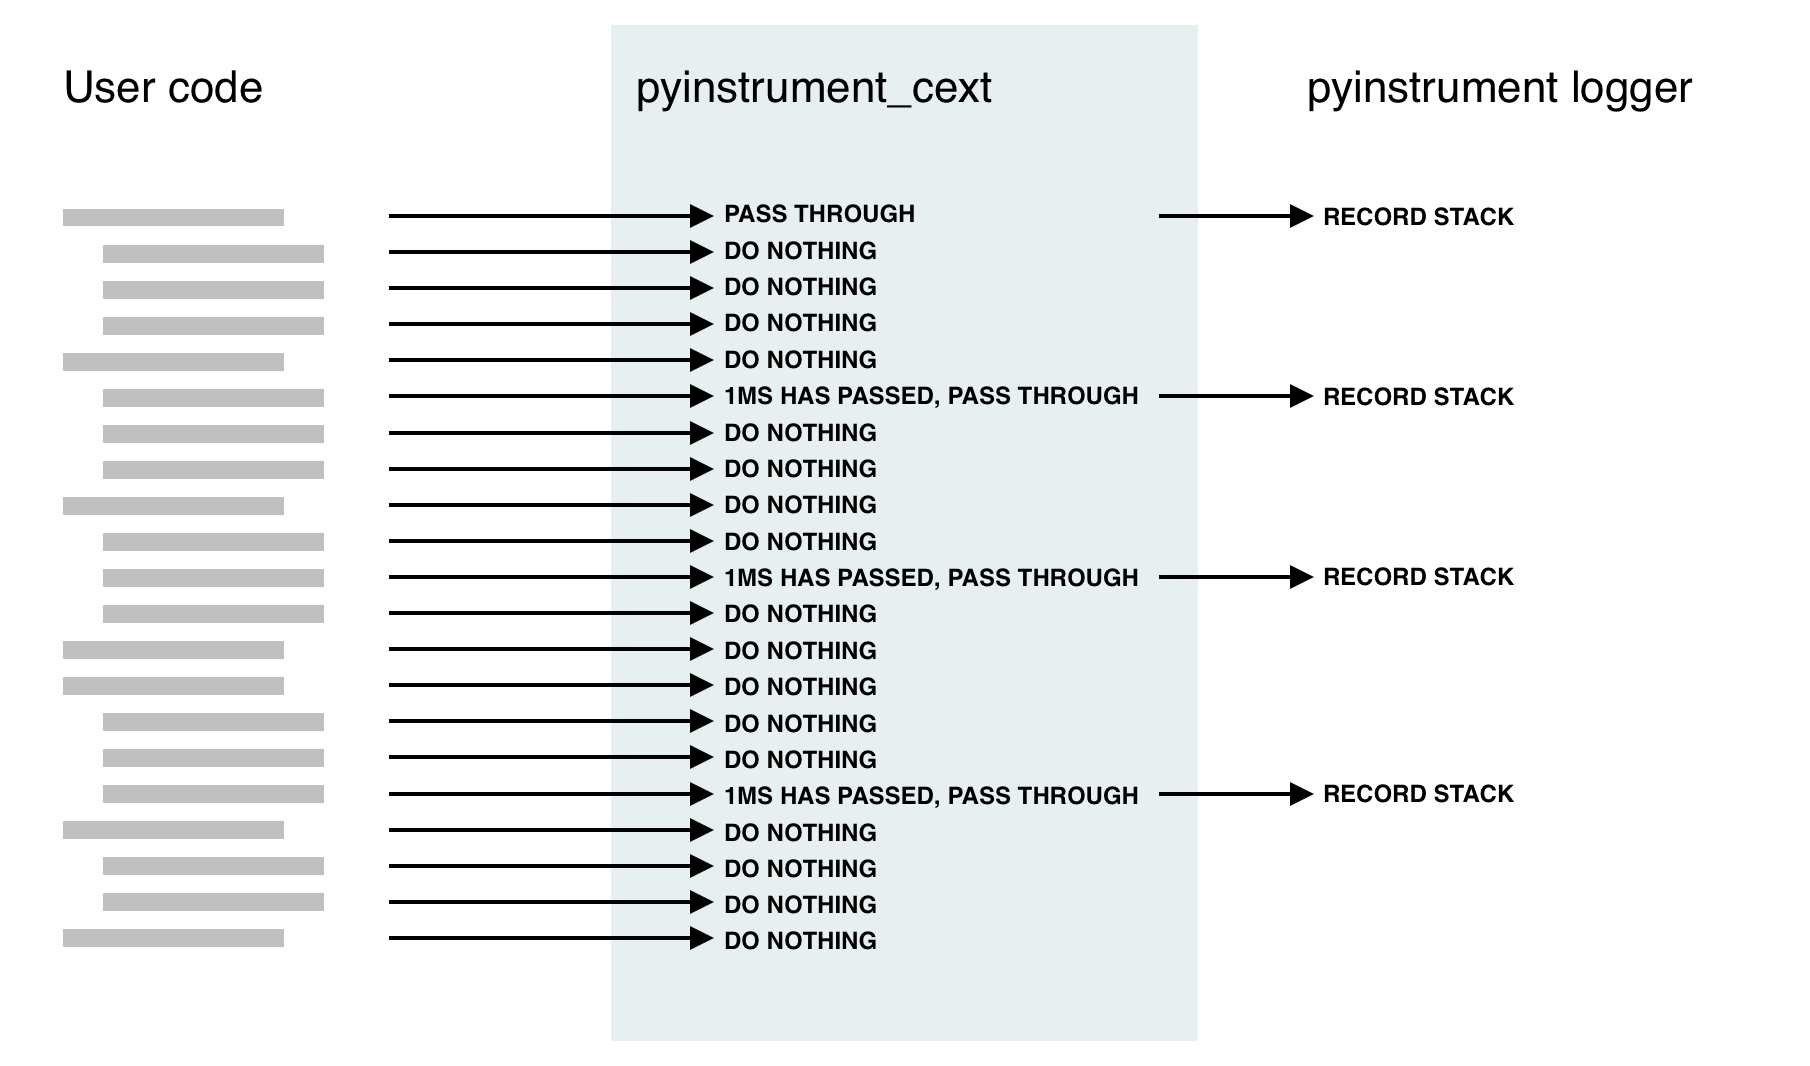
As far as Python’s concerned, it works exactly the same as cProfile, so there are no more problems with signals. What’s more, it’s still really fast - half the overhead of cProfile, while getting the benefits of recording the entire stack.
| Django template render × 4000 | Overhead | |
|---|---|---|
| Base | ████████████████ 0.33s | |
| pyinstrument | ████████████████████ 0.43s | 30% |
| cProfile | █████████████████████████████ 0.61s | 84% |
| profile | ██████████████████████████████████...██ 6.79s | 2057% |
A few more things in this release:
- The internals have been refactored to allow different recorders. The first alternate recorder is a ‘timeline’ recorder, allowing linear recording of program execution, for other outputs like flame charts.
- Renderers are now also modular and swappable. This cleanly factors the console and HTML outputs, but allows expansion to more outputs in the future, like a JSON output (and flame :))
So if you’re in the Python performance game, pip install pyinstrument or hit up github.com/joerick/pyinstrument and let me know what you think of the new version!
Footnotes
-
This is especially a problem for Django, where the runserver command runs on a different thread. ↩